RFM Analysis with Power BI
Customer segmentation with RFM Analysis

Table of content
Overview of RFM
The RFM Model
The RFM Segments
The RFM Scores
Power BI Analysis
- Data cleaning
- Getting the RFM values
- Calculating the RFM scores
Assigning the RFM Segment
How does RFM analysis add value to businesses?
Prerequisite: Knowledge of Power BI and DAX
RFM is a marketing technique that is used to quantitatively rank and group customers based on their recency, frequency, and monetary total to segment them into a homogenous group.
R — the most recent date a customer purchased from the business
F — how frequently does a customer purchases from the business
M — the monetary value of the customer’s purchase.
The Frequency and Monetary value give insights about the Customer Lifetime Value while the Recency measure retention and gives insights into the retention and customer engagement
The RFM Model
The RFM model ranks customers into different segments or categories based on their recency, frequency, and monetary scores. The RFM score is on a scale of 1–5 with one being the lowest and 5 being the highest.
Low recency scores, i.e., 1- 2/3 indicate that a customer has recently purchased from your store. This is contrary for Frequency and Monetary as low F and M scores indicated that a customer rarely visits or spends a lot of money in your store.
The Recency, Frequency, and monetary values have been calculated based on the values in the data set.
Scores are written as 123 or 534 with the first number representing the R score, the second number representing the F score, and the third number representing the M score.
Different types of customer segments can be created with the RFM model, I have adopted the segments recommended in this article. It also explains RFM analysis in detail.
The RFM Segments
The RFM segments and scores are defined for each business and can differ for businesses.

The RFM Scores

Let’s get our hands dirty with the Power BI analysis
Dataset: I used the superstore dataset for this analysis.
Data cleaning:
- Remove other columns: The data had too many columns, so I removed all the columns I did not need. For this analysis, I need just three columns: customer_name, Order_date, Sales_amount, and Product (didn’t really need this, just pulled it in).
- Renamed columns: I initially used Mockaroo to generate mock data, but, it did not give the result I wanted. I wanted to analyze data for a consulting firm. I renamed the columns to names that were applicable to a consulting firm.
Customer name — Partner Name
Product name — Service Rendered
Sales — Amount
3. Changed Type: I changed the data type of some columns like the Sales_amount column to Fixed decimal instead of Decimal so Power BI can recognize it as a currency field
Data Analysis with DAX
Getting my R, F, and M values
R — since R measures the most recent transaction, we need to get the last transaction date of each customer to determine their R-value.
Last_transcation date = MAXX(FILTER(‘Orders’, ‘Orders’[Partner Name] = Orders[Partner Name]), ‘Orders’[Order Date])R-value
Recency Value = DATEDIFF([Last_transcation date], TODAY(), DAY)F — the F-value is derived from the number of distinct times the customers have purchased from your store. For this, I will be using the Order date. For better accuracy, you can use the Order ID or Transaction ID.
F-value
Frequency value = DISTINCTCOUNT('Orders'[Order Date])M — The monetary value takes different fields into consideration depending on how your data is structured. You can take into consideration the sales and quantity of your data captured in both fields. For my analysis, I used the Amount field only.
M-value
Monetary value = SUM(Orders[Amount])Now that we have gotten our RFM values, we assign the RFM scores to each partner.
Calculating the RFM scores
The RFM scores will be calculated by first creating a calculated table. The table is created using the Partner name and the calculated RFM values. This table will be modeled to another table which will be imported in the latter part of this article.
RFM Table = SUMMARIZE('Orders', 'Orders'[Partner Name], "Recency Value", [Recency Value], "Frequency Value", [Frequency value], "Monetary Value", [Monetary value])Assigning the RFM scores using percentiles
The percentile of the RFM value is used to assign scores to each customer. A percentile is a statistical term that is used to express how a score compares to other scores in the same set.
A new column is created for each of the scores.
Create a new column called R-score
R-score =
SWITCH (
   TRUE (),
   [R value] <= PERCENTILE.INC ( 'RFM table'[R Value], 0.20 ), "5",
   [R value] <= PERCENTILE.INC ( 'RFM table'[R Value], 0.40 ), "4",
   [R Value] <= PERCENTILE.INC ( 'RFM table'[R Value], 0.60 ), "3",
   [R value] <= PERCENTILE.INC ( 'RFM table'[R Value], 0.80 ), "2",
   "1"
        )
Create a new column called F-score
F-score =
SWITCH (
  TRUE (),
   [F value] <= PERCENTILE.INC ( 'RFM table'[F Value], 0.20 ), "1",
   [F value] <= PERCENTILE.INC ( 'RFM table'[F Value], 0.40 ), "2",
   [F Value] <= PERCENTILE.INC ( 'RFM table'[F Value], 0.60 ), "3",
   [F value] <= PERCENTILE.INC ( 'RFM table'[F Value], 0.80 ), "4",
   "5"
        )
Create a new column called M-score
M-score=
SWITCH (
TRUE (),
[F value] <= PERCENTILE.INC ( 'RFM table'[F Value], 0.20 ), "1",
[F value] <= PERCENTILE.INC ( 'RFM table'[F Value], 0.40 ), "2",
[F Value] <= PERCENTILE.INC ( 'RFM table'[F Value], 0.60 ), "3",
[F value] <= PERCENTILE.INC ( 'RFM table'[F Value], 0.80 ), "4",
"5"
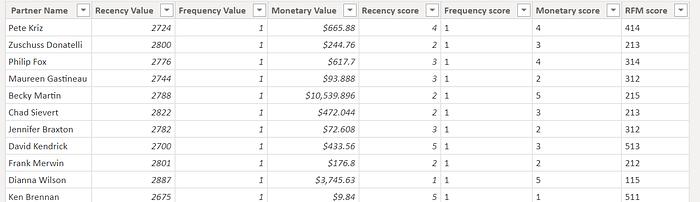
)The RFM Score
To get the combination of the scores to give the RFM score, we create a new column called RFM that concatenates the three columns just created
RFM score = 'RFM Table'[Recency score] & 'RFM Table'[Frequency score] & 'RFM Table'[Monetary score]Your RFM table should now look like this
Assigning the Segment to each score
Create an RFM Segment table that has a list of all the segments you have grouped your customers into and the corresponding scores of each segment. I will be importing this Segment score table.
Model the tables: Create a relationship between the RFM table — RFM score column and the Segment scores table — scores column.
Your model should now look somewhat like this:
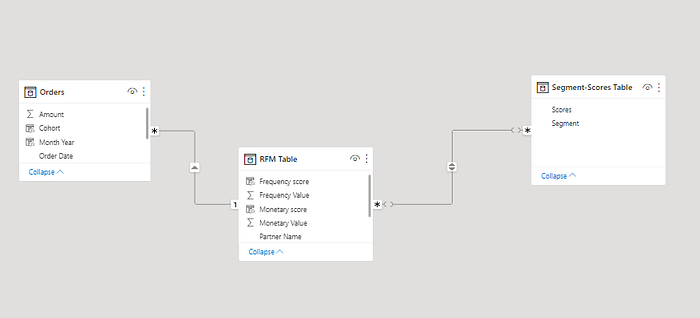
You have successfully performed an RFM analysis.
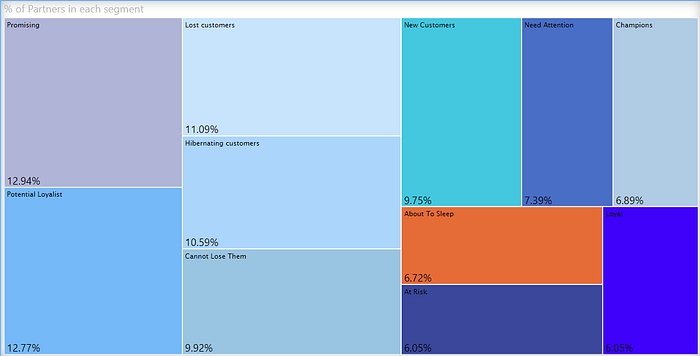
I created a simple Treemap visual that shows the percentage of Partners in each RFM segments
How does RFM analysis add value to businesses?
RFM analysis helps you understand your customers and gives insights into the different segments your customers belong to. Some benefits of RFM analysis are:
- It helps you understand your customer behavior.
- Gives insights to your most and least valuable customers, thus, allowing the business to create a unique customer journey.
- Businesses can now perform targeted ads for each customer segment.
